
Contributed by Jeremy Zechar
Hello, dear reader from the future. Perhaps you’re reading this without context, so allow me to set the scene. In March of 2017, RMS invited me, an unsuspecting client, to join their Impact Trek to Nepal. Seven other trekkers and I visited Build Change, an organization whose Nepali operation seeks to help improve construction and retrofitting practices in the villages struck hardest by the April 2015 Gorkha earthquake. We toured some of those villages and regrouped at Build Change headquarters in Kathmandu. If, after reading the piece below, you want to know more, send me a message. Or read some of the other blogs.
If writing about music is like dancing about architecture, what does that make writing about architecture? Um, tedious? Some of the trekkers were (somehow, unbelievably) lulled to sleep by the violent rocking of the vehicles that transported us along some of Nepal’s finest mountain “roads.” But hot jostling cars don’t do it for me. Despite being educated as a seismologist, I’ve found almost no better sleep aid than discussions of structural engineering. My attention span for earthquake engineering details is shorter than the time you just spent reading this sentence. At the risk of committing heresy, I’ll say it: buildings are boring. So when the rest of the trekkers headed to the labs at Kathmandu University to see how walls are stress tested, it wasn’t only anti-social tendencies that led me to stay behind at Build Change HQ*.
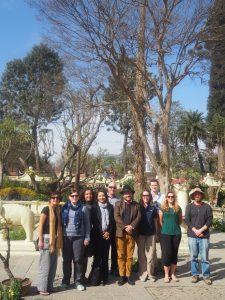
Noll Tufani (Center) with RMS Trekkers and Build Change Staff
I started sniffing around for data. And, because it’s 2017, it didn’t take much sniffing to find heaps. I simply told Noll Tufani, the Build Change Country Director in Nepal, that I was interested in the data that Build Change collects, and I wanted to hear about any related challenges where I might be able to help. (I’m handier with a keyboard than I am with brick and mortar.) He pulled in some colleagues and together we had an hour-long, freewheeling conversation that can be distilled down to:
- Build Change in Nepal has data. Duh.
- Build Change in Nepal has many different ideas for data products.
- Build Change in Nepal has many different target audiences for those data products, and each audience requires a tailored message.
- But Build Change in Nepal has no fixed priorities or detailed plan for developing data products.
(I suspect that you could replace “Build Change in Nepal” with the name of most non-profit organizations in the world and the same statements would apply.) Having no set priorities is not necessarily a bad thing; in the case of Build Change in Nepal, it just means that the development is being driven by the interests and skills of those involved. Let me tell you, then, about two relevant data sources.
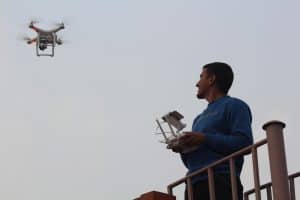
Uttam testing the drone before aerial mapping commenced.
One of the activities that Build Change in Nepal is pursuing is 3D modeling of the villages where they’re involved; to this end, they’re conducting drone flights and experimenting with different camera settings. This is happening because Uttam, one of the Build Change dudes, is interested in drones. (My empirical research indicates that so are most dudes in the world. Oh, and when Uttam is not busy at Build Change, he’s running his own startup.) Turning the image data into a 3D model is not a huge challenge, and Uttam can simply choose one of several available software packages to do so. The resulting models can be used to plan rebuilding and, in places where it’s possible to make repeat flights, give a very rough idea of construction progress.
Build Change in Nepal has also conducted several surveys and tracked construction progress for every house with which they’re involved (2000+ at the time of this writing. One of these surveys collects information about each construction site—for example, the distance to the nearest source of water—and another, a homeowner preference survey, allows Build Change to identify gaps between the types of dwellings that villagers want to live in and the types of dwellings that the federal government has approved. These data are stored in a database and cry out for visualization. At my day job analyzing natural catastrophe models, one of the things I commonly do is visualize data stored in a database. Hooray, I can help!
So, in the coming weeks and months, I’ll be working with Khushbu, an energetic student who is already engaged in extracting some of the survey and progress data for internal reports. (In her spare time, she’s pursuing a Master’s in sociology. When do these kids sleep?) We’ll prototype an interactive map capturing results of the homeowner preference survey and construction status. We’re hopeful that this pilot project will show Noll and others what is possible with the data that Build Change in Nepal already has, and that it will jump start discussions around planning and priorities for the future of data at Build Change.
* I once lived w/ a dude who conducted state-of-the-art rock mechanics experiments, but our conversations revolved around water balloons, Napoleon Dynamite, and roasting coffee. And I don’t even drink coffee.